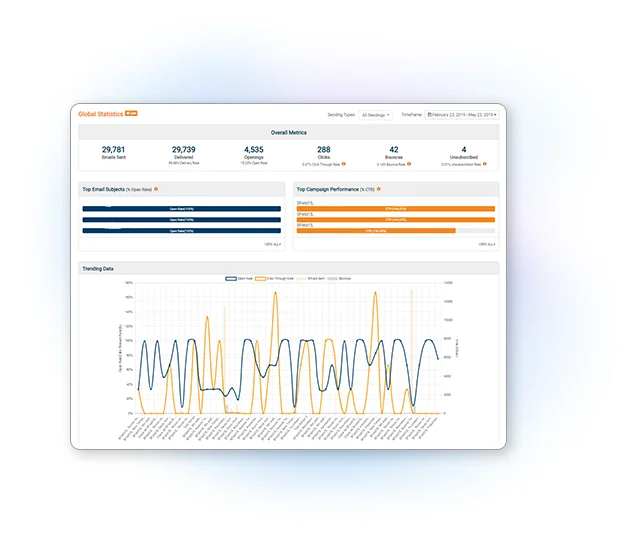
Perform a deeper analysis of your statistics of email marketing campaigns, compare and contrast the effectiveness of each of your campaigns and see which of them has achieved the results that benefit your company and your goals.
Access your tools, select statistics by campaign and within the left panel you will find the Compare tab. Activate it selecting the number of campaigns you want to contrast, regardless of date and from there you will have access to all the campaigns that you have sent.
Once inside this window, you will have a general view of the name of the campaigns you have selected and the general metrics of each campaign where you will see the number of emails sent, percentage of emails opened, clicks and emails not delivered. With graphs you can visualize the behavior of these newsletter metrics which are ordered by the days or hours in which they were sent.

In this monthly report you will find general numbers for:
Compare using geolocation
You can also check with the geolocation maps from where your campaign emails have been opened and compare the countries or cities where your emails have arrived. Know which email client platform is the most popular among its subscribers and which operating systems have been best received. You will be able to recognize over time which campaigns have been most successfully opened with Windows, Unix or MacOS operating systems and if there have been recurring failures due to incompatibility with some of them. Without leaving aside mobile devices, know on what days your campaigns received higher opening rates from mobile devices.
Contrast each campaign by presenting a statistical white label report in PDF.
Get a comparative analysis of the links that have received the most clicks in all your campaigns and contrast their effectiveness throughout the different shipments. If you own an E-Commerce business, this option will give you the possibility to know which products were better received or how many of your subscribers clicked on the call to action executed during your last Valentine's campaign. In addition, you can generate a comparative report of the statistics of your newsletters in PDF format that you can share with your work team and clients, as well as recognize the campaigns in which you complied with the KPIS for email marketing that you put together to your marketing team in your company or with the client of your agency at the beginning of your marketing strategy.
Keeping track of your data per campaign you can, for example, compare your last and current Christmas campaign, in order to make the decision about which changes you need to make for your next shipment. Use this functionality to find out what have been the best seasons to promote your products or services and the days when your campaign had better opening rates. Do not lose sight of the measurement of your email marketing campaign statistics, take the time to study them and generate the best results for your product or service.
Find instructional videos and all the necessary information for your email marketing strategy from our Mailpro Academy.
Email Marketing Software
& Email Automation
This site uses Cookies, by continuing your navigation, you accept the deposit of third-party cookies intended to offer you videos,
sharing buttons, but also understand and save your preferences. Understand how we use cookies and why: More information
