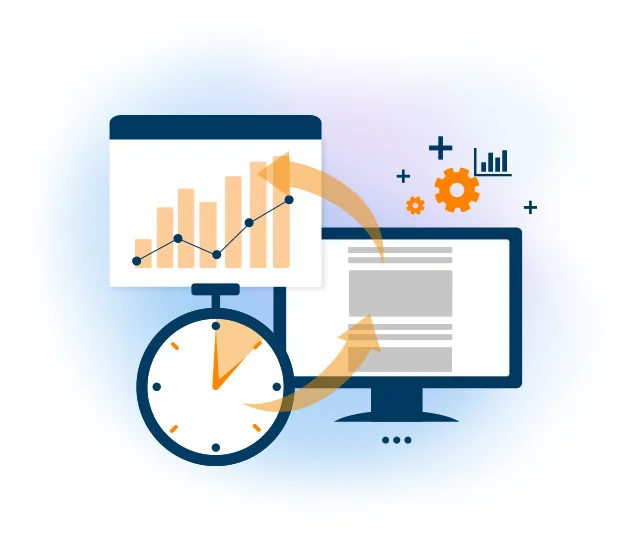
You have sent your first email campaign and now you want to know how many people have received and interacted with your email. With our analysis of Mailpro metrics and statistics, you will be able to know in detail each of the most important numbers for your newsletter campaign. From the statistics tab, by clicking on campaigns, it will show you the list of campaigns you currently have. From there, select the campaign you want to view and it will show you all its statistics and comparative graphs.
View from our platform an accurate summary with:
- Delivery rate: the amount of emails sent and delivered to subscribers as well as the number of badmail, messages that did not reach their destination.
From this section you will find the percentage of email sent and by clicking on the badmail section, it will show you a complete list with the email users to whom your message was not delivered. - Reactivity rate: where you will find the opening rate, number of clicks and percentage of emails that have canceled the subscription.
By clicking on the openings box, you will be able to see the complete list of email subscribers who have already opened their message, as well as the time, exact day and address book of each user.
With the openings and clicks graphs you can read the general percentages of opening emails and interactions in the links, as well as a much more specific detail of the openings and clicks per day or hour. Know which subscriber interacted with your links, at what time and what day that click provided the call to actions that you created for your email marketing campaign.
As a general rule, all emails should include links that redirect to URLs of specific pages of your website for subscribers to access them and thus perform actions of purchase, registration or download of files. If you do not yet have a website, by inserting links in your newsletter, you can redirect your subscribers to the contents of their social networks. Remember to always use buttons to make the call to action attractive to the eyes of your readers.
If you need to share with your work team or client, you can download the statistical report of your email campaign in XLS, SLSX, CSV formats and select specifically if you want to download the opening percentages, clicks, unopened emails or badmail and sort them by time, agenda of addresses or email. If you need to save time, for convenience and speed , you can also download a customizable white label PDF report in which you can place the logo of your agency, company or product and present it to your clients or marketing managers. This customizable metrics report will show you a complete summary of the general numbers of your email campaigns, as well as the statistics of openings by Geolocation, email client and operating systems.

Also, you can compare the most recent campaign you have created with passes and know the general comparative statistics of the number of emails sent, percentages of openings, clicks and badmail. With the support of a comparative graph you can visualize the behavior of these campaign metrics that you can order by days or hours. In addition, with comparative geolocation statistics, you will know where the sent emails have been opened and compare the countries or cities where your messages have arrived. This option will allow you to check the effectiveness of your content during the past campaigns and know what have been the best seasons to promote your products or services and days when your campaign had the best opening rates. By measuring your data in real time and keeping a history for days and hours, you will know what is the ideal time in which your subscribers have more interaction, allowing you to know which are your most committed subscribers or to attract those who have had low interaction with links.
Mailpro has videos and instructional material for you to learn how to read and interpret each one of the metrics of your newsletter, at your disposal and they give you the real-time statistics of your email marketing campaigns.
Email Marketing Software
& Email Automation
This site uses Cookies, by continuing your navigation, you accept the deposit of third-party cookies intended to offer you videos,
sharing buttons, but also understand and save your preferences. Understand how we use cookies and why: More information
